Edit chart
Loading graph
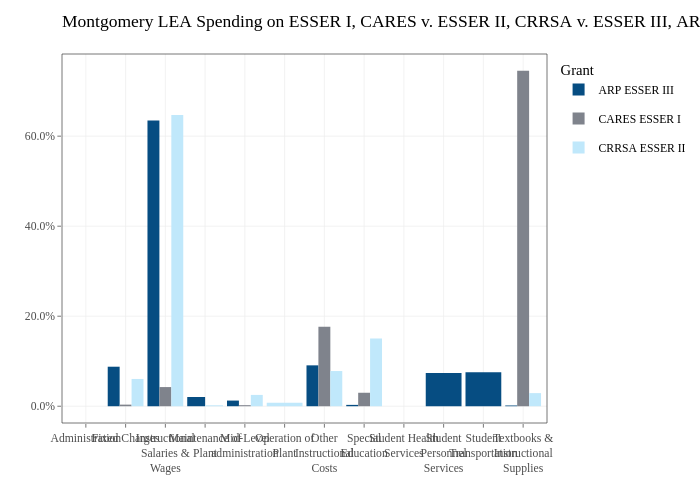
Jdayhoff's interactive graph and data of "Montgomery LEA Spending on ESSER I, CARES v. ESSER II, CRRSA v. ESSER III, ARP" is a , showing ARP ESSER III, CARES ESSER I, CRRSA ESSER II. The x-axis shows values from 0.4 to 12.6. The y-axis shows values from -0.0372649244221364 to 0.782563412864864.