Edit chart
Loading graph
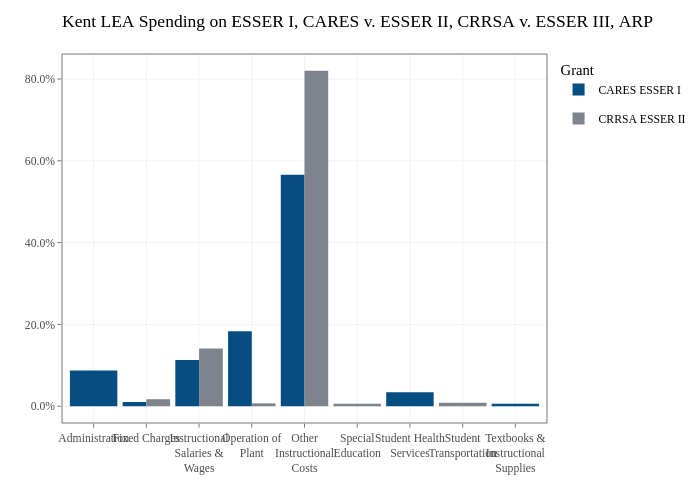
Jdayhoff's interactive graph and data of "Kent LEA Spending on ESSER I, CARES v. ESSER II, CRRSA v. ESSER III, ARP" is a , showing CARES ESSER I vs CRRSA ESSER II. The x-axis shows values from 0.4 to 9.6. The y-axis shows values from -0.0410073650709013 to 0.861154666488927.