Edit chart
Loading graph
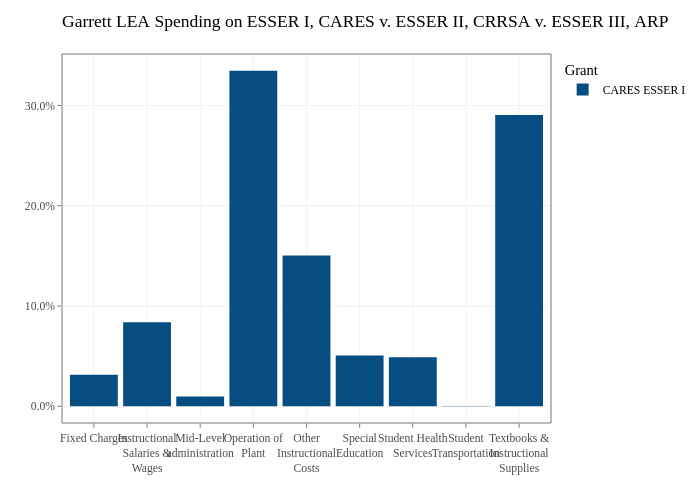
Jdayhoff's interactive graph and data of "Garrett LEA Spending on ESSER I, CARES v. ESSER II, CRRSA v. ESSER III, ARP" is a bar chart, showing CARES ESSER I. The x-axis shows values from 0.4 to 9.6. The y-axis shows values from -0.0167290383268836 to 0.351309804864555.