Edit chart
Loading graph
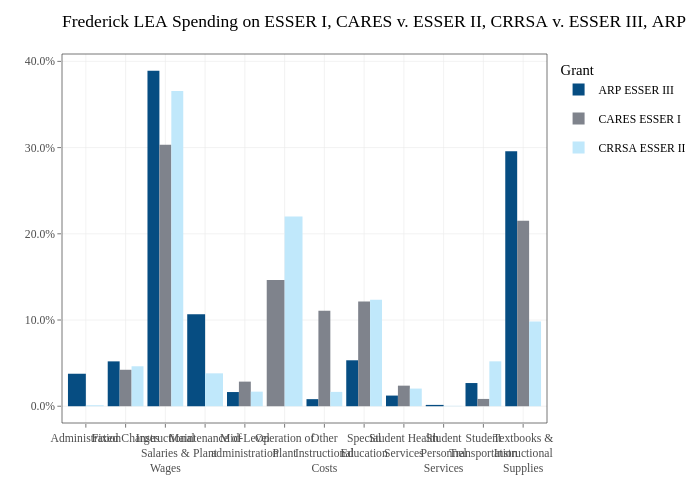
Jdayhoff's interactive graph and data of "Frederick LEA Spending on ESSER I, CARES v. ESSER II, CRRSA v. ESSER III, ARP" is a , showing ARP ESSER III, CARES ESSER I, CRRSA ESSER II. The x-axis shows values from 0.4 to 12.6. The y-axis shows values from -0.0194551156056418 to 0.408557427718478.