Edit chart
Loading graph
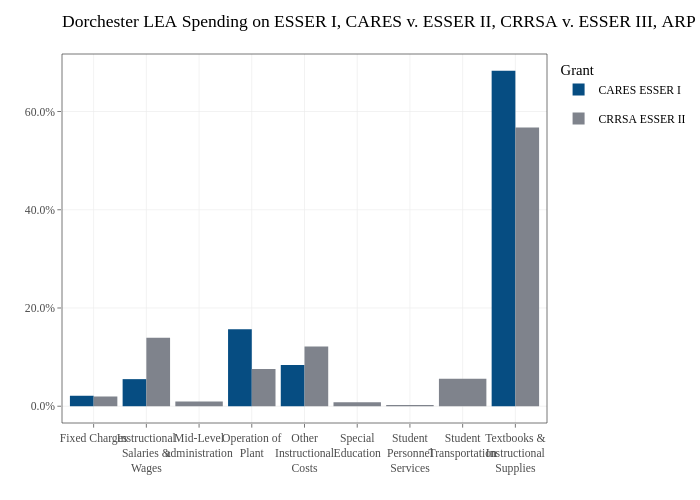
Jdayhoff's interactive graph and data of "Dorchester LEA Spending on ESSER I, CARES v. ESSER II, CRRSA v. ESSER III, ARP" is a , showing CARES ESSER I vs CRRSA ESSER II. The x-axis shows values from 0.4 to 9.6. The y-axis shows values from -0.0341461834592408 to 0.717069852644056.