Edit chart
Loading graph
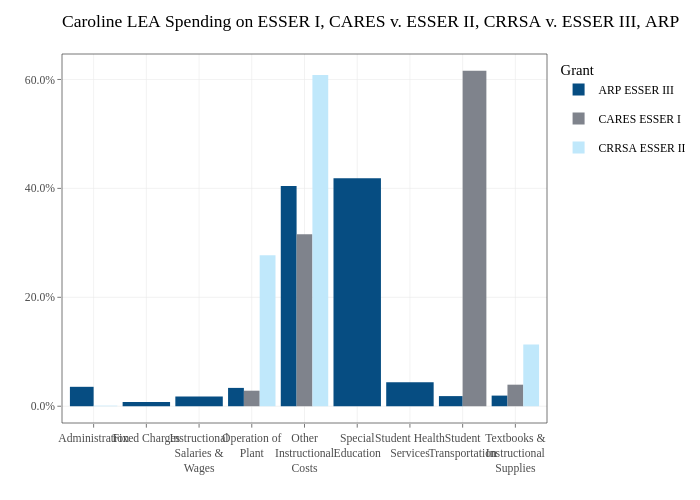
Jdayhoff's interactive graph and data of "Caroline LEA Spending on ESSER I, CARES v. ESSER II, CRRSA v. ESSER III, ARP" is a , showing ARP ESSER III, CARES ESSER I, CRRSA ESSER II. The x-axis shows values from 0.4 to 9.6. The y-axis shows values from -0.0307974870404065 to 0.646747227848536.