Edit chart
Loading graph
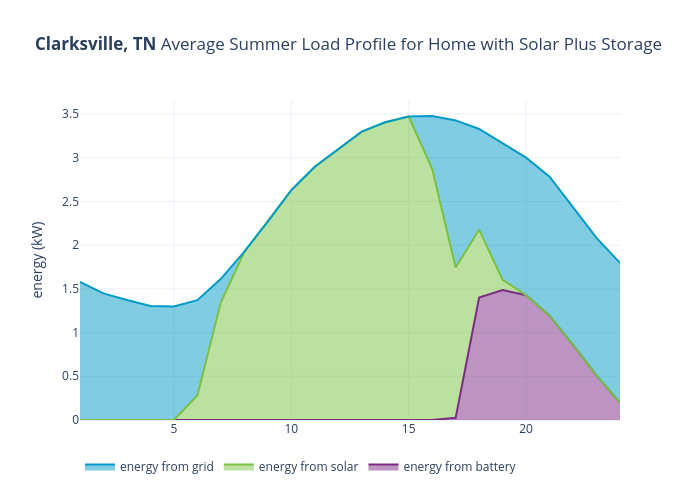
Jcombs's interactive graph and data of "Clarksville, TN Average Summer Load Profile for Home with Solar Plus Storage" is a line chart, showing energy from battery, energy from solar, energy from grid; with energy (kW) in the y-axis. The x-axis shows values from 1 to 24. The y-axis shows values from 0 to 3.660801052631579.