Edit chart
Loading graph
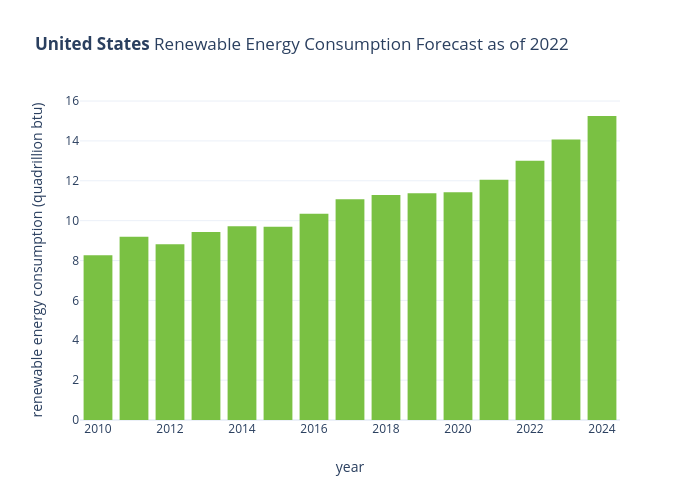
Jcombs's interactive graph and data of "United States Renewable Energy Consumption Forecast as of 2022 " is a bar chart; with year in the x-axis and renewable energy consumption (quadrillion btu) in the y-axis.. The x-axis shows values from 2009.5 to 2024.5. The y-axis shows values from 0 to 16.05263157894737.