Edit chart
Loading graph
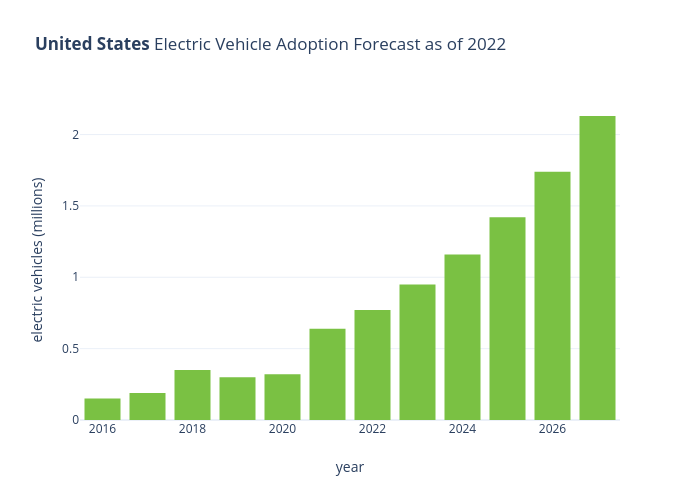
Jcombs's interactive graph and data of "United States Electric Vehicle Adoption Forecast as of 2022" is a bar chart; with year in the x-axis and electric vehicles (millions) in the y-axis.. The x-axis shows values from 2015.5 to 2027.5. The y-axis shows values from 0 to 2.2421052631578946.