Edit chart
Loading graph
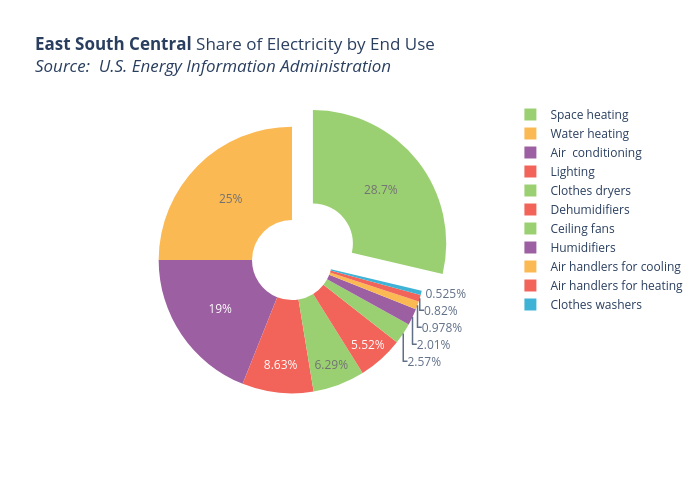
Jcombs's interactive graph and data of "East South Central Share of Electricity by End UseSource: U.S. Energy Information Administration" is a pie. The x-axis shows values from 0 to 0. The y-axis shows values from 0 to 0.