Edit chart
Loading graph
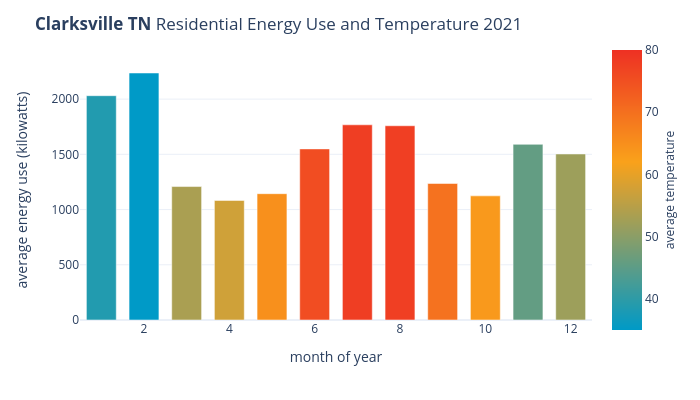
Jcombs's interactive graph and data of "Clarksville TN Residential Energy Use and Temperature 2021" is a bar chart; with month of year in the x-axis and average energy use (kilowatts) in the y-axis.. The x-axis shows values from 0 to 0. The y-axis shows values from 0 to 0.