Edit chart
Loading graph
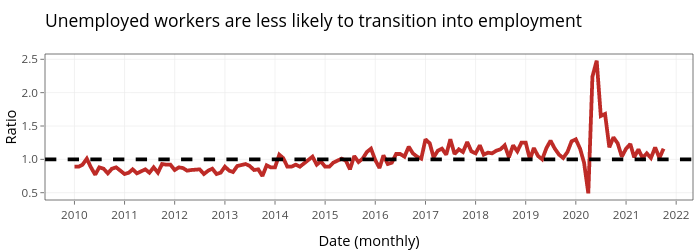
Jayalakc's interactive graph and data of "Unemployed workers are less likely to transition into employment" is a filled line chart; with Date (monthly) in the x-axis and Ratio in the y-axis.. The x-axis shows values from 14395.45 to 19115.55. The y-axis shows values from 0.3905 to 2.5795.