Edit chart
Loading graph
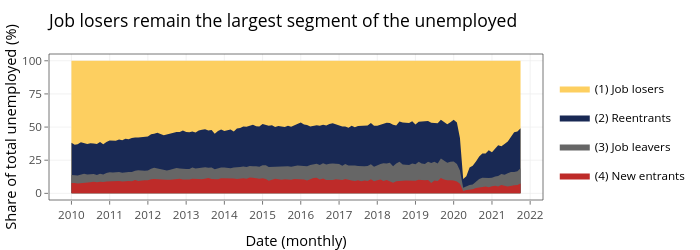
Jayalakc's interactive graph and data of "Job losers remain the largest segment of the unemployed" is a filled line chart, showing (1) Job losers, (2) Reentrants, (3) Job leavers, (4) New entrants; with Date (monthly) in the x-axis and Share of total unemployed (%) in the y-axis.. The x-axis shows values from 14395.45 to 19115.55. The y-axis shows values from -5.005 to 105.105.