Edit chart
Loading graph
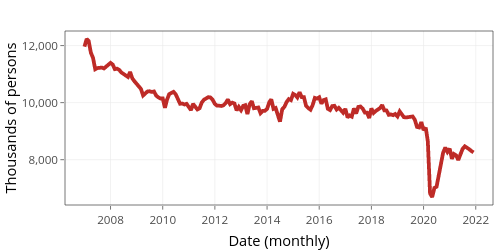
Jayala_edi's interactive graph and data of "Thousands of persons vs Date (monthly)" is a filled line chart; with Date (monthly) in the x-axis and Thousands of persons in the y-axis.. The x-axis shows values from 13241.6 to 19234.4. The y-axis shows values from 6411.75 to 12511.25.