Edit chart
Loading graph
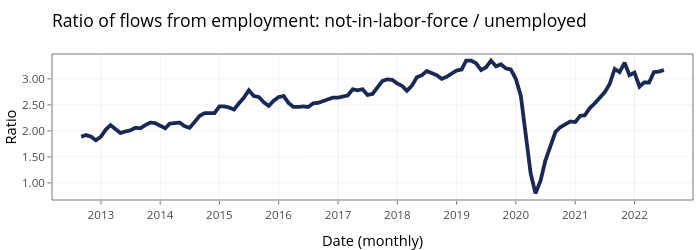
Jayala_edi's interactive graph and data of "Ratio of flows from employment: not-in-labor-force / unemployed" is a filled line chart; with Date (monthly) in the x-axis and Ratio in the y-axis.. The x-axis shows values from 15404.5 to 19353.5. The y-axis shows values from 0.6725 to 3.4775.