Edit chart
Loading graph
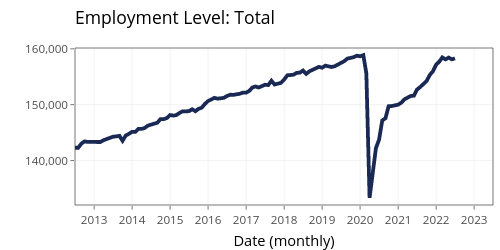
Jayala_edi's interactive graph and data of "Employment Level: Total" is a filled line chart; with Date (monthly) in the x-axis. The x-axis shows values from 15522 to 19539.2. The y-axis shows values from 132042.7 to 160143.3.