Edit chart
Loading graph
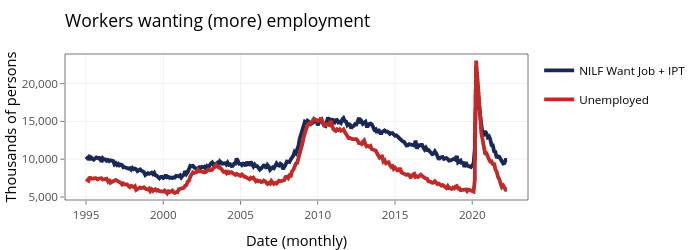
Jayala_edi's interactive graph and data of "Workers wanting (more) employment" is a filled line chart, showing NILF Want Job + IPT vs Unemployed; with Date (monthly) in the x-axis and Thousands of persons in the y-axis.. The x-axis shows values from 8633.4 to 19580.6. The y-axis shows values from 4603.15 to 23915.85.