Edit chart
Loading graph
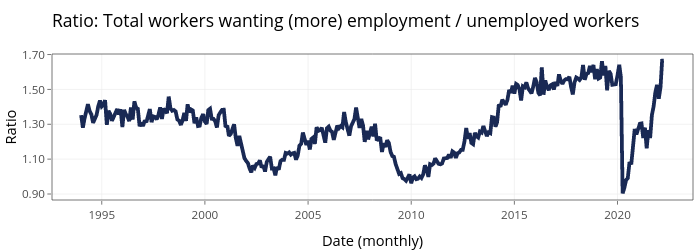
Jayala_edi's interactive graph and data of "Ratio: Total workers wanting (more) employment / unemployed workers" is a filled line chart; with Date (monthly) in the x-axis and Ratio in the y-axis.. The x-axis shows values from 8250.15 to 19598.85. The y-axis shows values from 0.865612941048241 to 1.70310748965809.