Edit chart
Loading graph
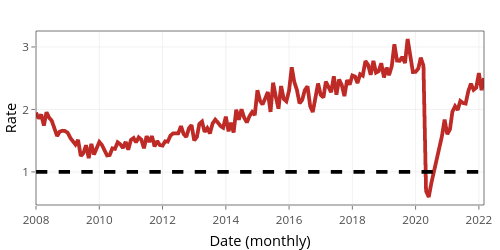
Jayala_edi's interactive graph and data of "Rate vs Date (monthly)" is a filled line chart; with Date (monthly) in the x-axis and Rate in the y-axis.. The x-axis shows values from 13879 to 19052. The y-axis shows values from 0.470291296259783 to 3.25582090411325.