Edit chart
Loading graph
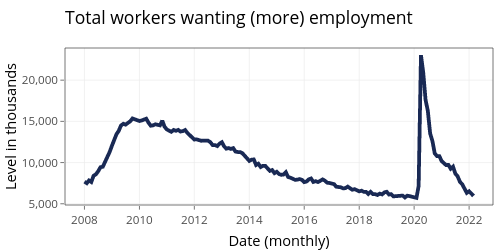
Jayala_edi's interactive graph and data of "Total workers wanting (more) employment" is a filled line chart; with Date (monthly) in the x-axis and Level in thousands in the y-axis.. The x-axis shows values from 13620.35 to 19310.65. The y-axis shows values from 4850.95 to 23904.05.