Edit chart
Loading graph
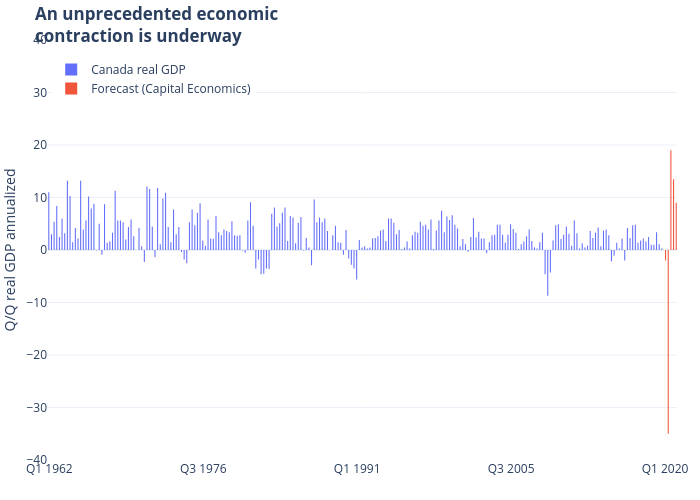
Jasonkirby's interactive graph and data of "An unprecedented economiccontraction is underway" is a bar chart, showing Canada real GDP vs Forecast (Capital Economics); with Q/Q real GDP annualized in the y-axis. The x-axis shows values from -0.5 to 236.5. The y-axis shows values from -40 to 40.