Edit chart
Loading graph
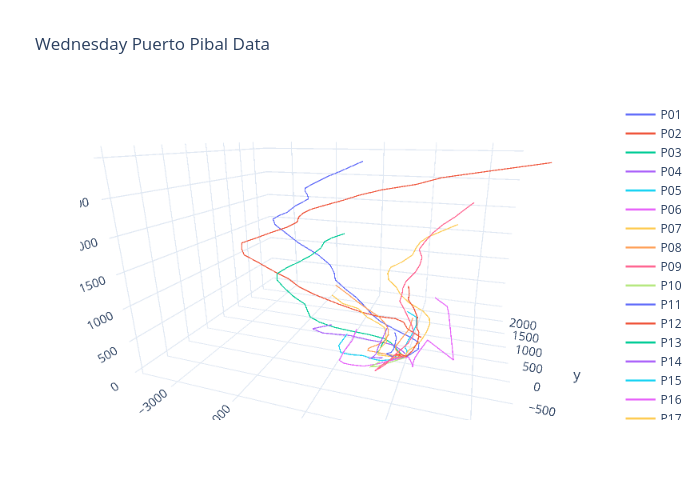
Jamswrs's interactive graph and data of "Wednesday Puerto Pibal Data" is a scatter3d, showing P01, P02, P03, P04, P05, P06, P07, P08, P09, P10, P11, P12, P13, P14, P15, P16, P17, P18. The x-axis shows values from -1 to 6. The y-axis shows values from -1 to 4.