Edit chart
Loading graph
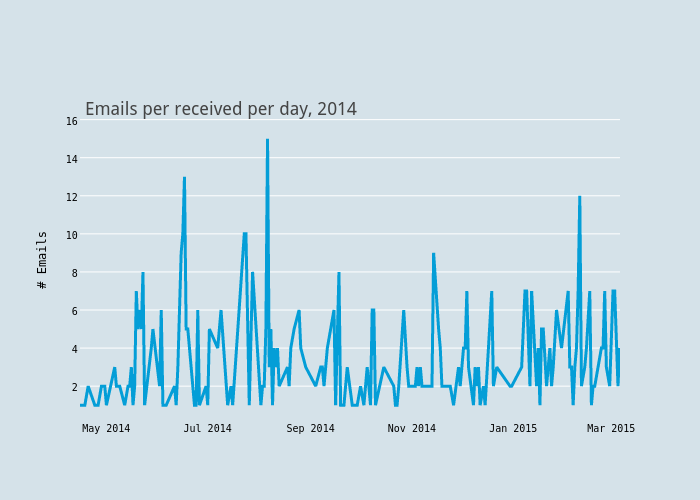
Jackp's interactive graph and data is a scatter chart; with # Emails in the y-axis. The x-axis shows values from 1397527760786.9102 to 1425618000000. The y-axis shows values from 0.2222222222222222 to 17.030864197530864. This visualization has the following annotation: Emails per received per day, 2014