Edit chart
Loading graph
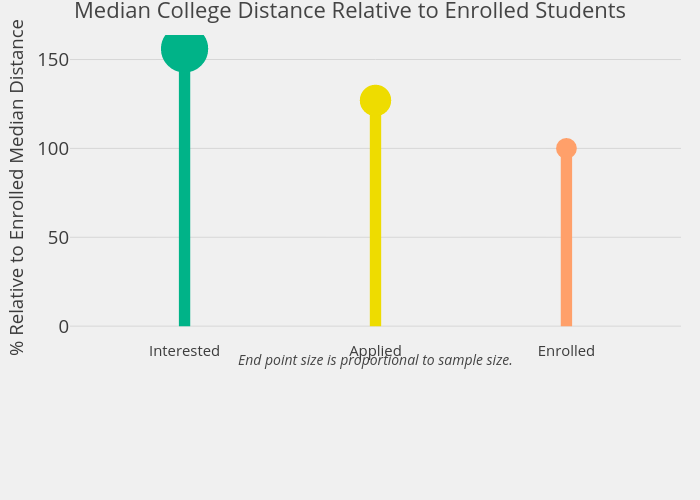
Ivyvine's interactive graph and data of "Median College Distance Relative to Enrolled Students" is a line chart, showing Interested, Applied, Enrolled, Applied, Enrolled, Interested; with % Relative to Enrolled Median Distance in the y-axis. The x-axis shows values from 0.4 to 3.6. The y-axis shows values from -7.8 to 163.8. This visualization has the following annotation: End point size is proportional to sample size.