Edit chart
Loading graph
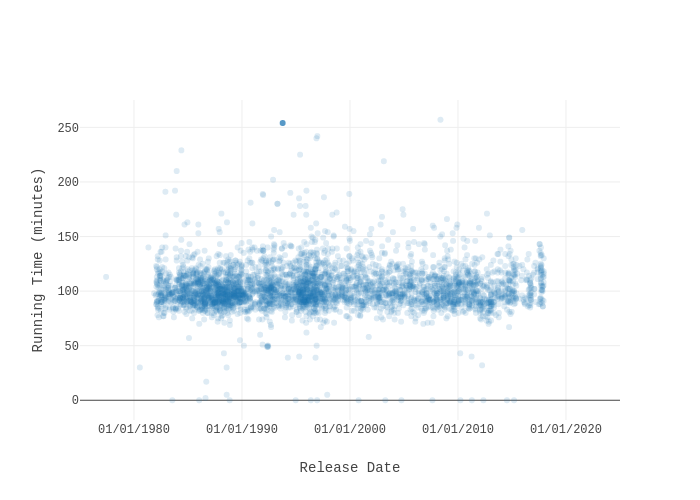
Ivan.himanen's interactive graph and data of "" is a scatter chart, showing trace 1; with Release Date in the x-axis and Running Time (minutes) in the y-axis.. The x-axis shows values from 1975-01-01 04:48:31.7647 to 2025-01-01 19:11:28.2353. The y-axis shows values from -18.968243539202803 to 275.96824353920283.