Edit chart
Loading graph
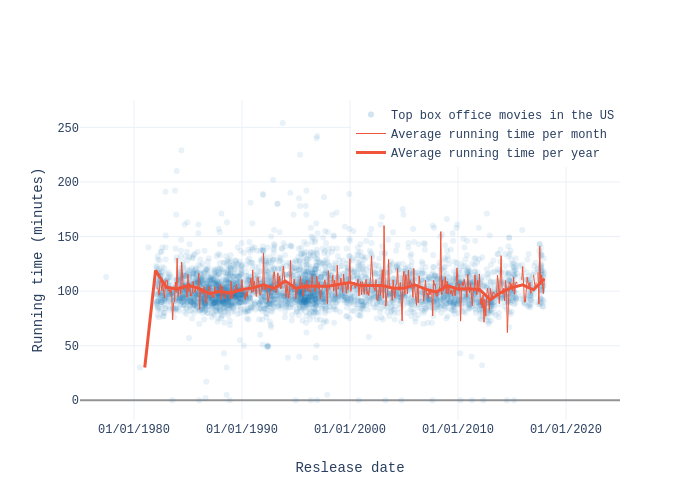
Ivan.himanen's interactive graph and data of "" is a scatter chart, showing Top box office movies in the US, Average running time per month, AVerage running time per year; with Reslease date in the x-axis and Running time (minutes) in the y-axis.. The x-axis shows values from 1975-01-01 to 2025-01-01 23:16:13.8602. The y-axis shows values from -18.968243539202803 to 275.96824353920283.