Edit chart
Loading graph
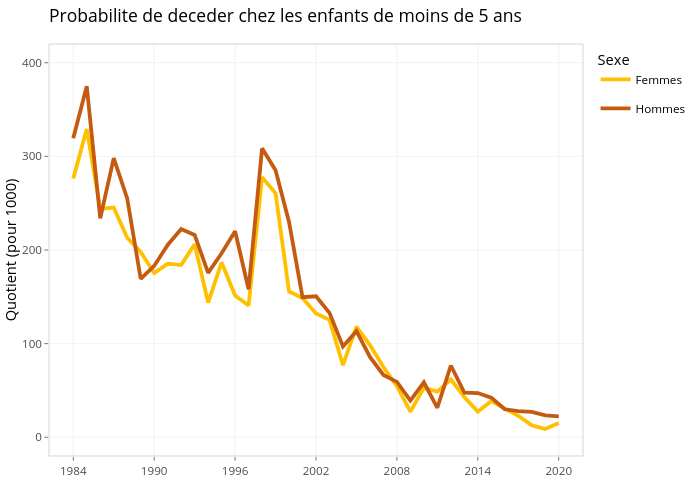
Ird.systech's interactive graph and data of "Probabilite de deceder chez les enfants de moins de 5 ans" is a line chart, showing Femmes vs Hommes; with Quotient (pour 1000) in the y-axis. The x-axis shows values from 1982.2 to 2021.8. The y-axis shows values from -20 to 420.