Edit chart
Loading graph
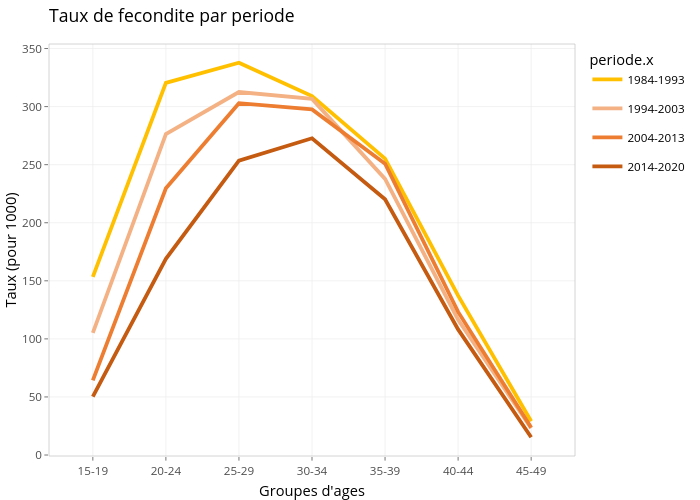
Ird.systech's interactive graph and data of "Taux de fecondite par periode" is a line chart, showing 1984-1993, 1994-2003, 2004-2013, 2014-2020; with Groupes d'ages in the x-axis and Taux (pour 1000) in the y-axis.. The x-axis shows values from 0.4 to 7.6. The y-axis shows values from -0.838412800266811 to 353.895735134687.