Edit chart
Loading graph
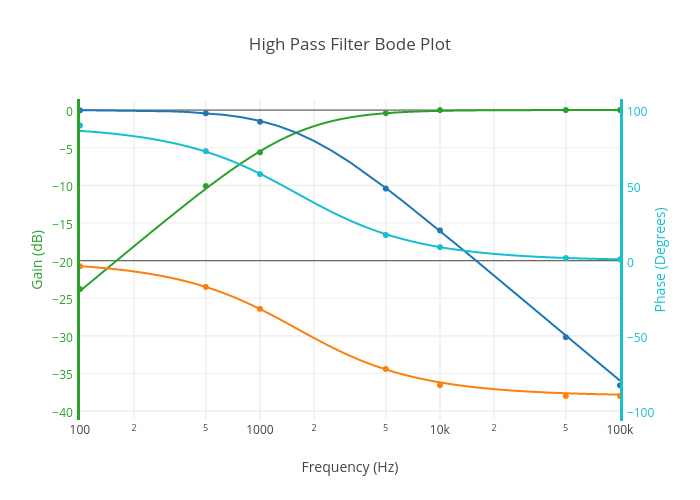
Inkychris's interactive graph and data of "High Pass Filter Bode Plot" is a scatter chart, showing Col2, Col3, Col5, Col6, Col5_Gain (dB), Col2_Gain (dB), Col7_Phase (Degrees), Col2_Phase (Degrees); with Frequency (Hz) in the x-axis and Gain (dB) in the y-axis.. The x-axis shows values from 2 to 5. The y-axis shows values from -41.19492879998939 to 1.3351452922777778.