Edit chart
Loading graph
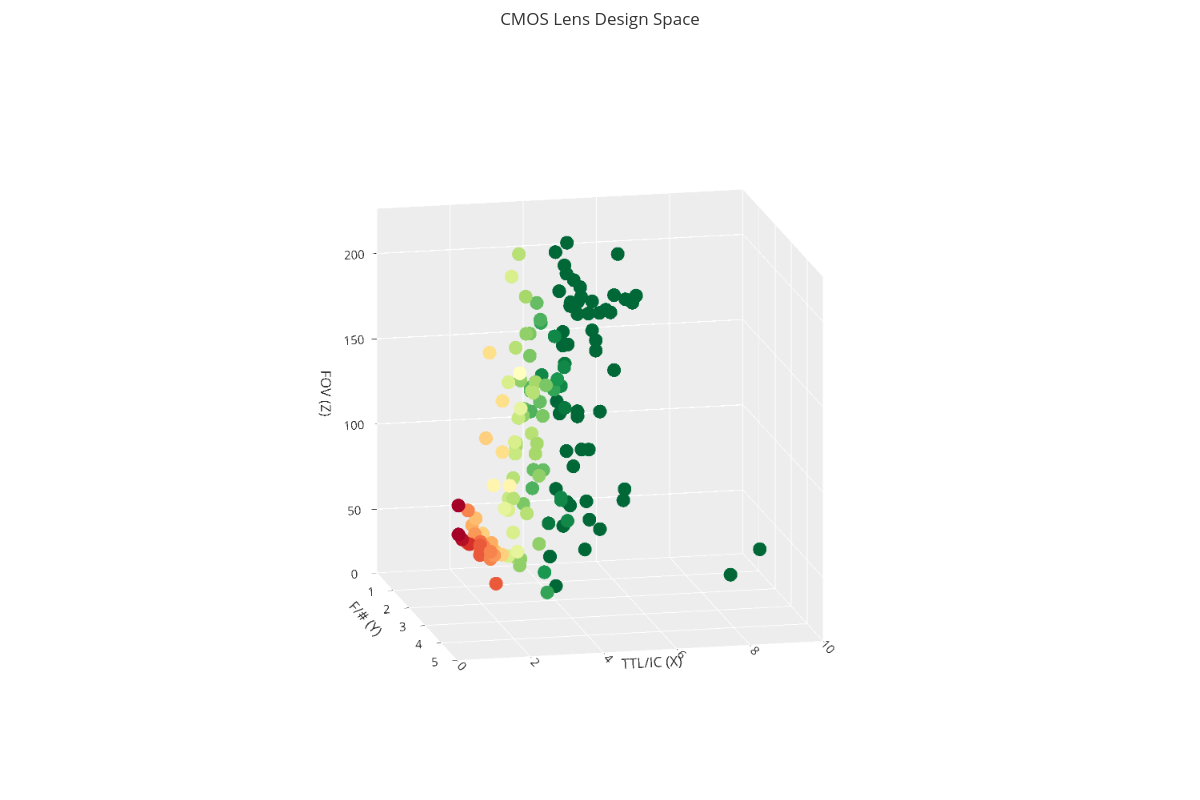
Ingo.foldvari's interactive graph and data of "CMOS Lens Design Space" is a scatter3d, showing FOV vs. F/# vs/ TTL/IC; with F/# in the x-axis and FOV in the y-axis.. The x-axis shows values from 0.9274104683195593 to 4.1725895316804404. The y-axis shows values from 5.8307030129124815 to 233.1692969870875.