Edit chart
Loading graph
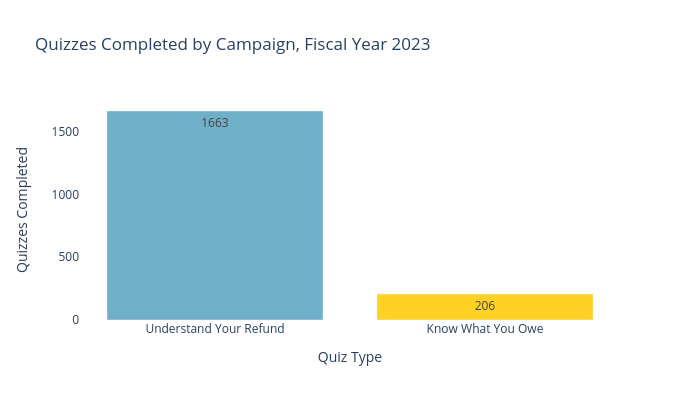
Ilstudentmoney's interactive graph and data of "Quizzes Completed by Campaign, Fiscal Year 2023" is a , showing Understand Your Refund vs Know What You Owe; with Quiz Type in the x-axis and Quizzes Completed in the y-axis.. The x-axis shows values from 0 to 0. The y-axis shows values from 0 to 0.