Edit chart
Loading graph
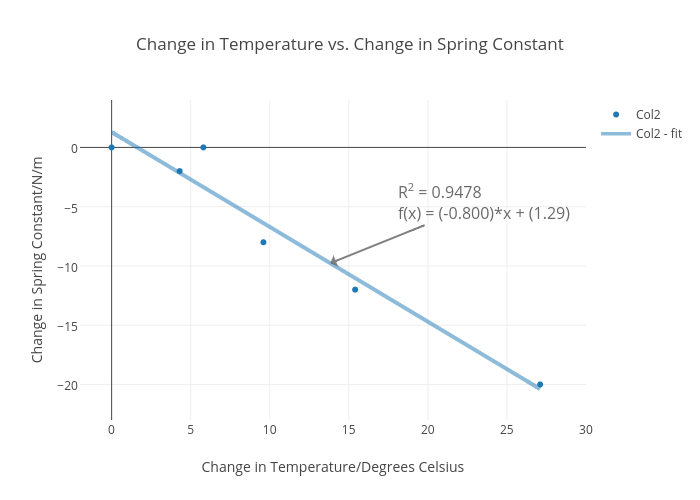
Ihajar's interactive graph and data of "Change in Temperature vs. Change in Spring Constant" is a scatter chart, showing Col2 vs Col2 - fit; with Change in Temperature/Degrees Celsius in the x-axis and Change in Spring Constant/N/m in the y-axis.. The x-axis shows values from -2 to 30. The y-axis shows values from -23 to 4. This visualization has the following annotation: R2 = 0.9478f(x) = (-0.800)*x + (1.29)