Edit chart
Loading graph
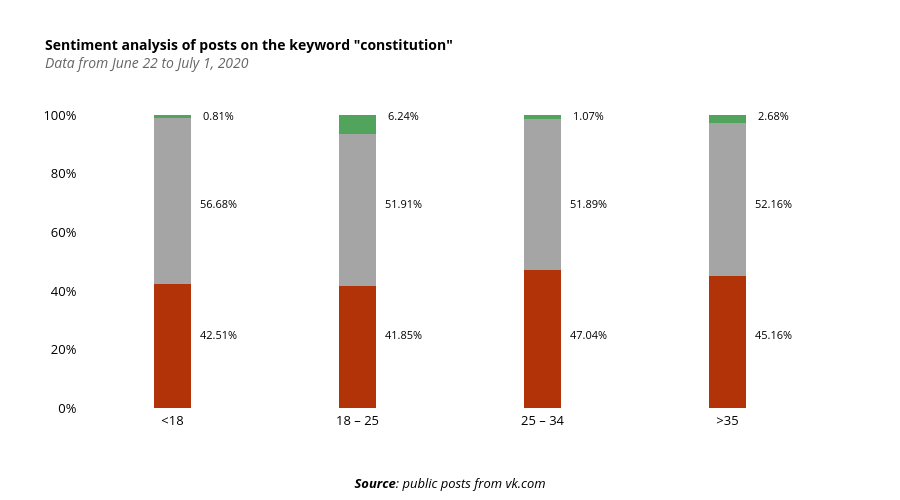
I-bond's interactive graph and data of "Sentiment analysis of posts on the keyword "constitution"Data from June 22 to July 1, 2020" is a stacked bar chart, showing Negative, Neutral, Positive; with Source: public posts from vk.com in the x-axis. The x-axis shows values from 0 to 0. The y-axis shows values from 0 to 0. This visualization has the following annotations: 42.51%; 0.81%; 56.68%; 41.85%; 6.24%; 51.91%; 47.04%; 1.07%; 51.89%; 45.16%; 2.68%; 52.16%