Edit chart
Loading graph
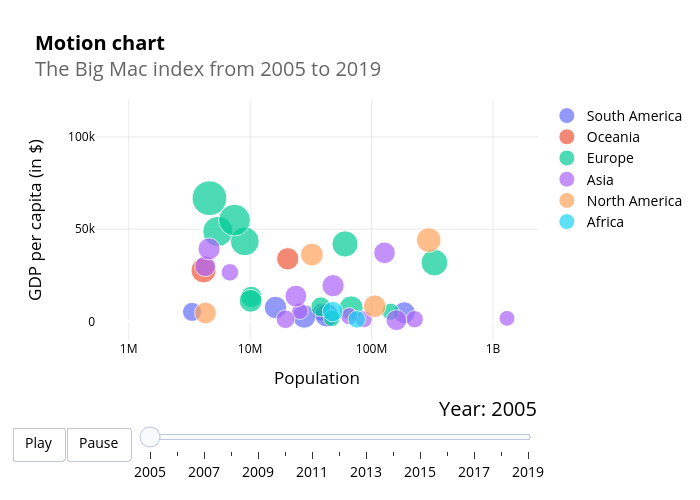
I-bond's interactive graph and data of "Motion chartThe Big Mac index from 2005 to 2019" is a scatter chart, showing South America, Oceania, Europe, Asia, North America, Africa; with Population in the x-axis and GDP per capita (in $) in the y-axis.. The x-axis shows values from 0 to 0. The y-axis shows values from -10000 to 120000.