Edit chart
Loading graph
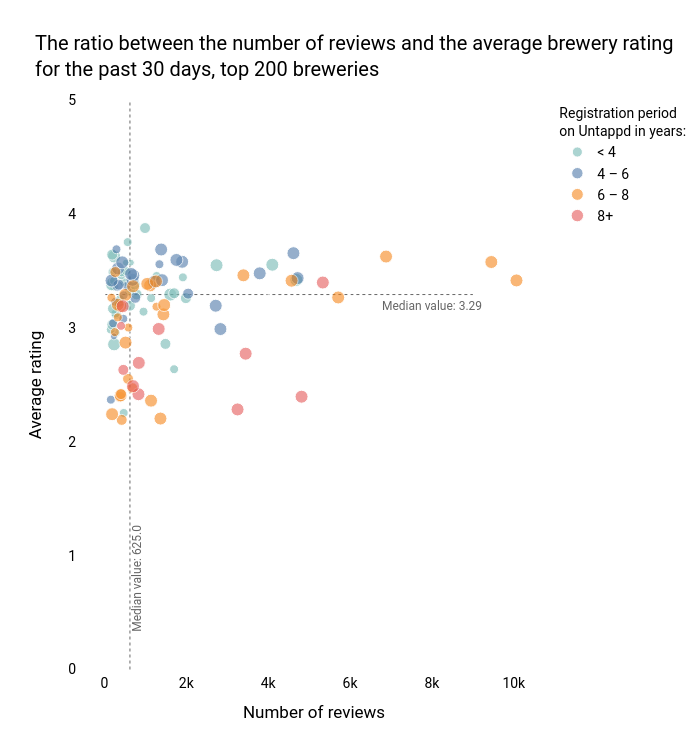
I-bond's interactive graph and data of "The ratio between the number of reviews and the average brewery rating for the past 30 days, top 200 breweries" is a scatter chart, showing < 4, 4 – 6, 6 – 8, 8+; with Number of reviews in the x-axis and Average rating in the y-axis.. The x-axis shows values from 0 to 0. The y-axis shows values from 0 to 0. This visualization has the following annotations: Median value: 3.29; Median value: 625.0