Edit chart
Loading graph
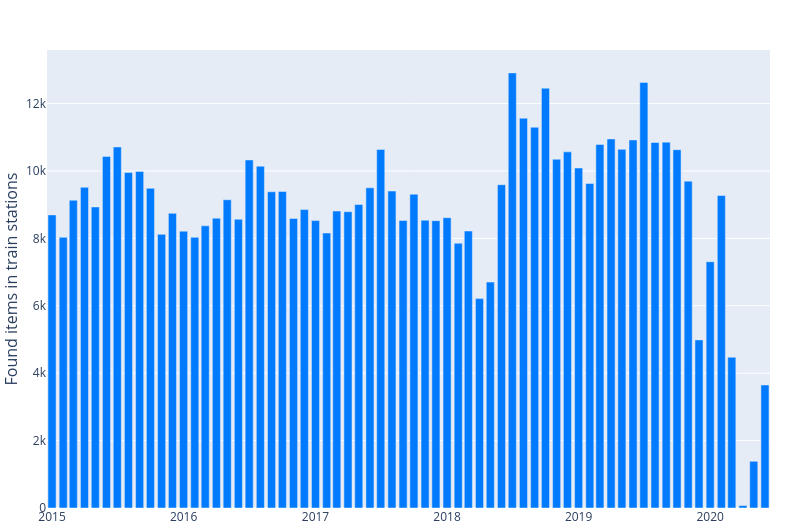
Hugolmn's interactive graph and data is a bar chart; with Found items in train stations in the y-axis. The x-axis shows values from 0 to 0. The y-axis shows values from 0 to 0.