Edit chart
Loading graph
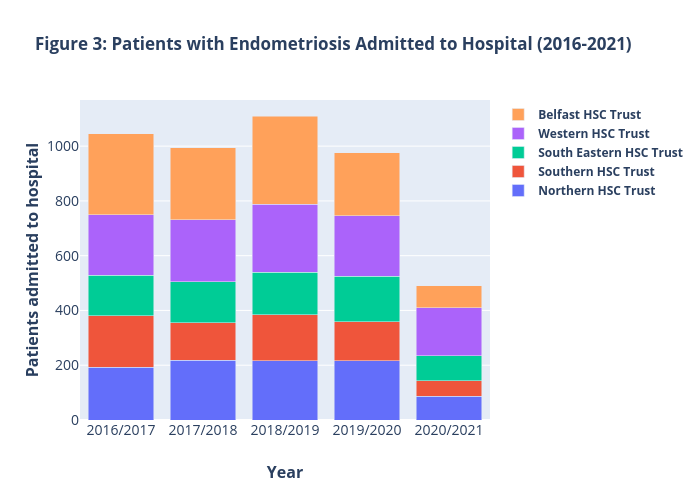
Hughess's interactive graph and data of "Figure 3: Patients with Endometriosis Admitted to Hospital (2016-2021)" is a stacked bar chart, showing Northern HSC Trust, Southern HSC Trust, South Eastern HSC Trust, Western HSC Trust, Belfast HSC Trust; with Year in the x-axis and Patients admitted to hospital in the y-axis.. The x-axis shows values from 0 to 0. The y-axis shows values from 0 to 0.