Edit chart
Loading graph
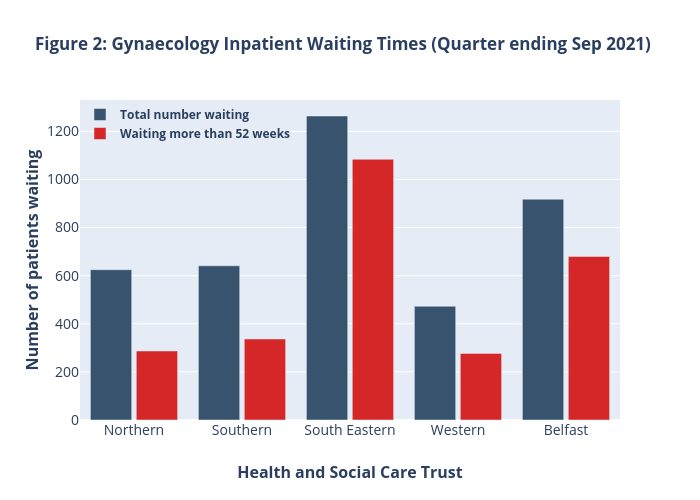
Hughess's interactive graph and data of "Figure 2: Gynaecology Inpatient Waiting Times (Quarter ending Sep 2021)" is a grouped bar chart, showing Total number waiting vs Waiting more than 52 weeks; with Health and Social Care Trust in the x-axis and Number of patients waiting in the y-axis.. The x-axis shows values from 0 to 0. The y-axis shows values from 0 to 0.