Edit chart
Loading graph
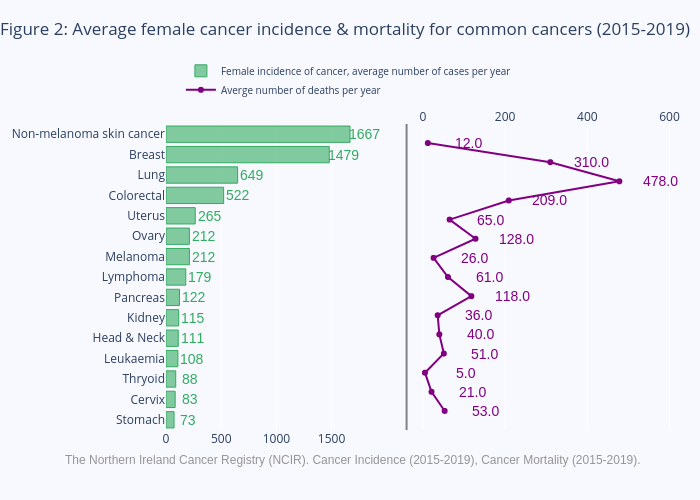
Hughess's interactive graph and data of "Figure 2: Average female cancer incidence & mortality for common cancers (2015-2019)" is a bar chart, showing Female incidence of cancer, average number of cases per year vs Averge number of deaths per year. The x-axis shows values from 0 to 0. The y-axis shows values from 0 to 0. This visualization has the following annotations: 12.0; 1667; 310.0; 1479; 478.0; 649; 209.0; 522; 65.0; 265; 128.0; 212; 26.0; 212; 61.0; 179; 118.0; 122; 36.0; 115; 40.0; 111; 51.0; 108; 5.0; 88; 21.0; 83; 53.0; 73; The Northern Ireland Cancer Registry (NCIR). Cancer Incidence (2015-2019), Cancer Mortality (2015-2019).