Edit chart
Loading graph
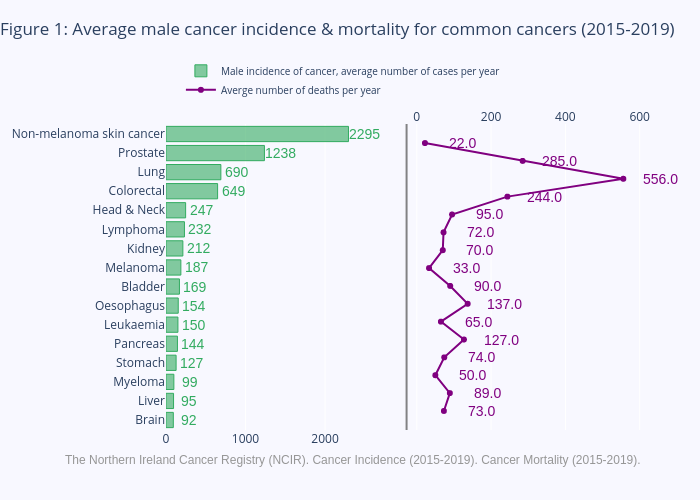
Hughess's interactive graph and data of "Figure 1: Average male cancer incidence & mortality for common cancers (2015-2019)" is a bar chart, showing Male incidence of cancer, average number of cases per year vs Averge number of deaths per year. The x-axis shows values from 0 to 0. The y-axis shows values from 0 to 0. This visualization has the following annotations: 22.0; 2295; 285.0; 1238; 556.0; 690; 244.0; 649; 95.0; 247; 72.0; 232; 70.0; 212; 33.0; 187; 90.0; 169; 137.0; 154; 65.0; 150; 127.0; 144; 74.0; 127; 50.0; 99; 89.0; 95; 73.0; 92; The Northern Ireland Cancer Registry (NCIR). Cancer Incidence (2015-2019). Cancer Mortality (2015-2019).