Edit chart
Loading graph
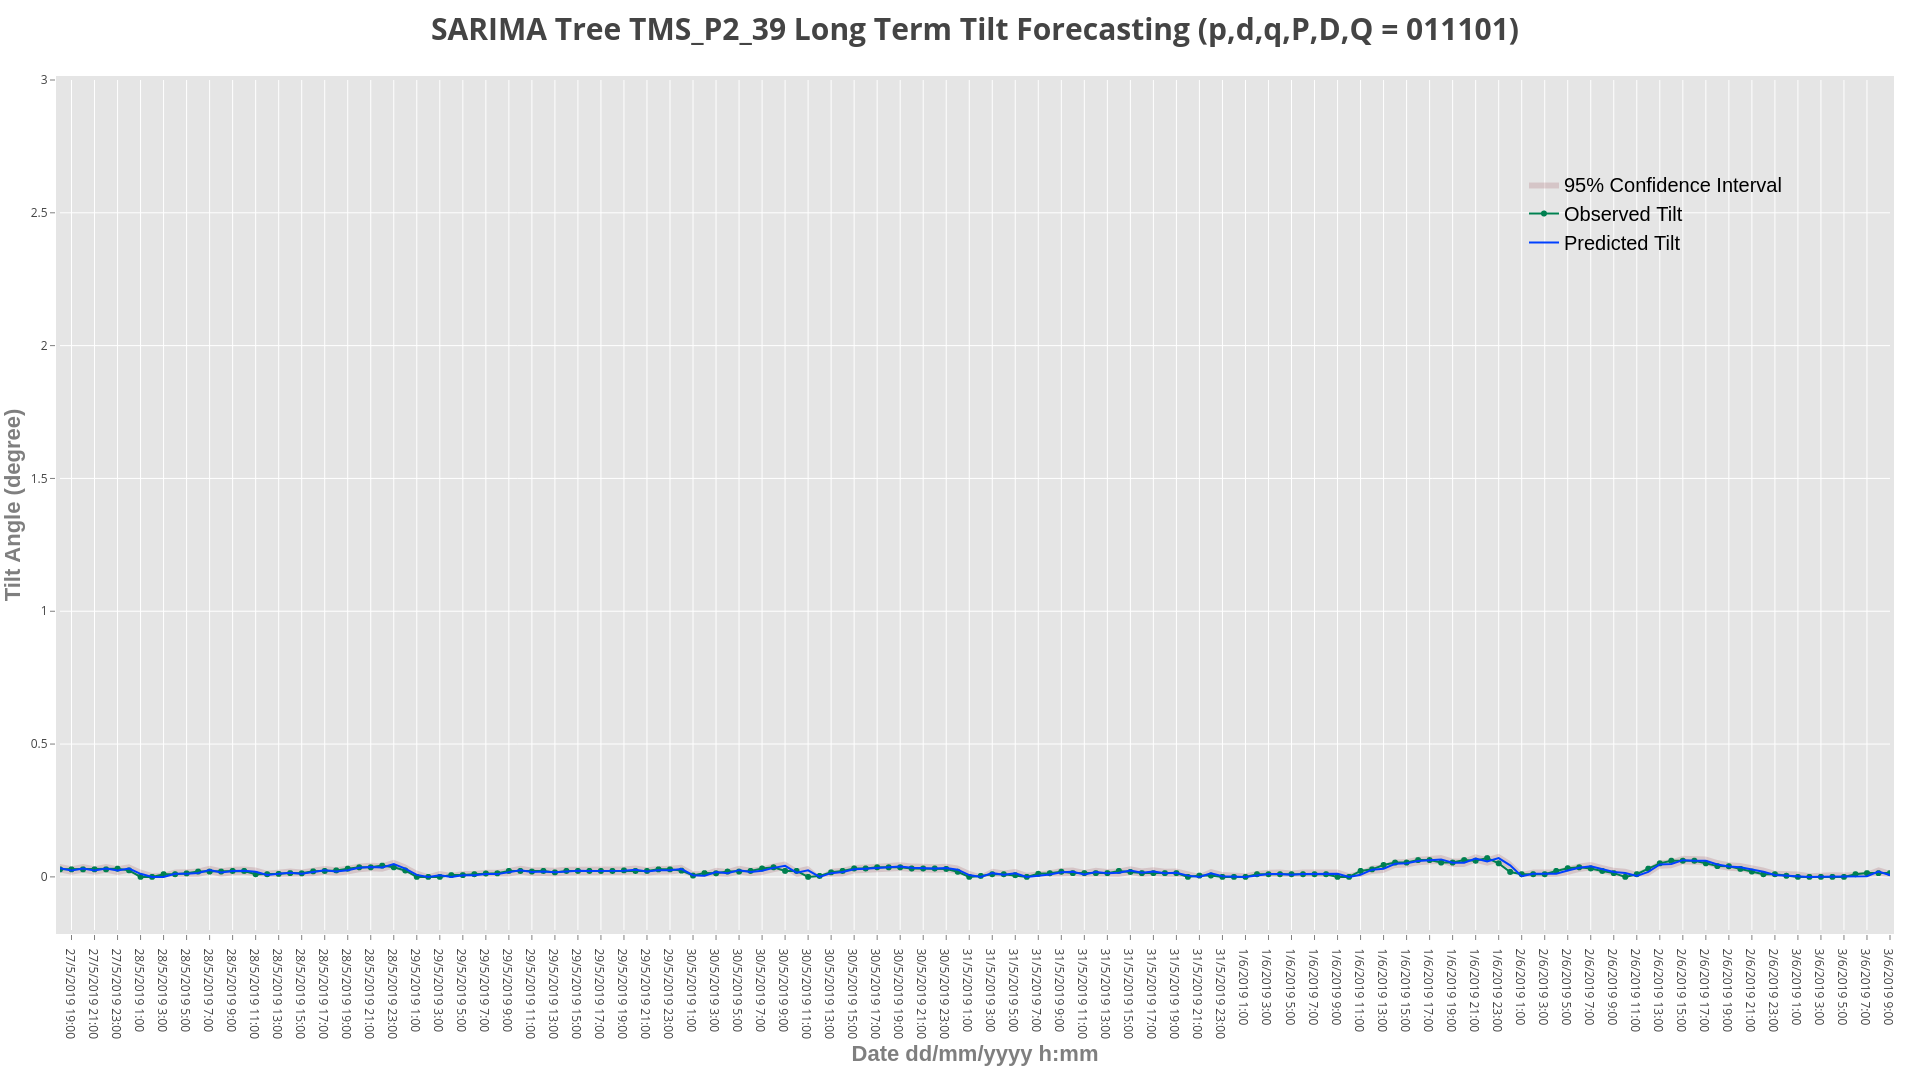
Honlihonli's interactive graph and data of "SARIMA Tree TMS_P2_39 Long Term Tilt Forecasting (p,d,q,P,D,Q = 011101)" is a filled scatter chart, showing 95% Confidence Interval, Observed Tilt, Predicted Tilt; with Date dd/mm/yyyy h:mm in the x-axis and Tilt Angle (degree) in the y-axis.. The x-axis shows values from 1 to 160. The y-axis shows values from -0.2 to 3.