Edit chart
Loading graph
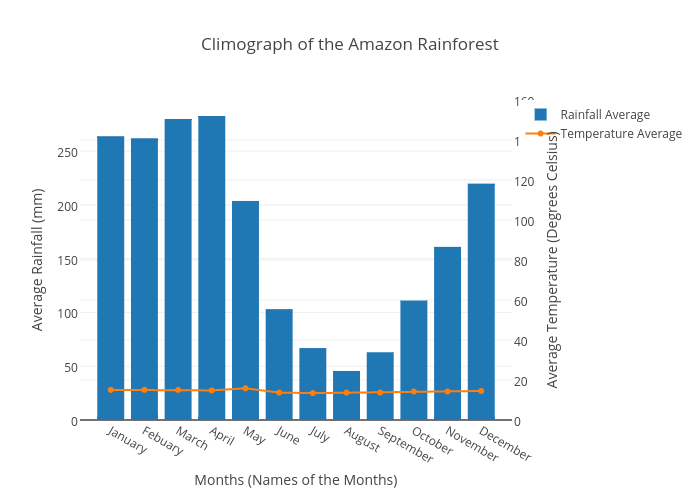
Hhmunshi's interactive graph and data of "Climograph of the Amazon Rainforest" is a bar chart, showing Rainfall Average vs Temperature Average; with Months (Names of the Months) in the x-axis and Average Rainfall (mm) in the y-axis.. The x-axis shows values from -0.6812529890004781 to 11.681252989000479. The y-axis shows values from 0 to 297.57894736842104.