Edit chart
Loading graph
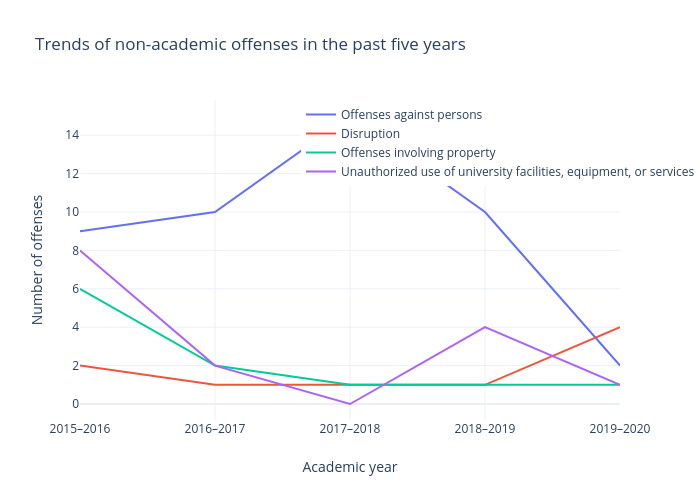
Hbrunelle24's interactive graph and data of "Trends of non-academic offenses in the past five years" is a line chart, showing Offenses against persons, Disruption, Offenses involving property, Unauthorized use of university facilities, equipment, or services; with Academic year in the x-axis and Number of offenses in the y-axis.. The x-axis shows values from 0 to 4. The y-axis shows values from -0.8333333333333331 to 15.833333333333334.