Edit chart
Loading graph
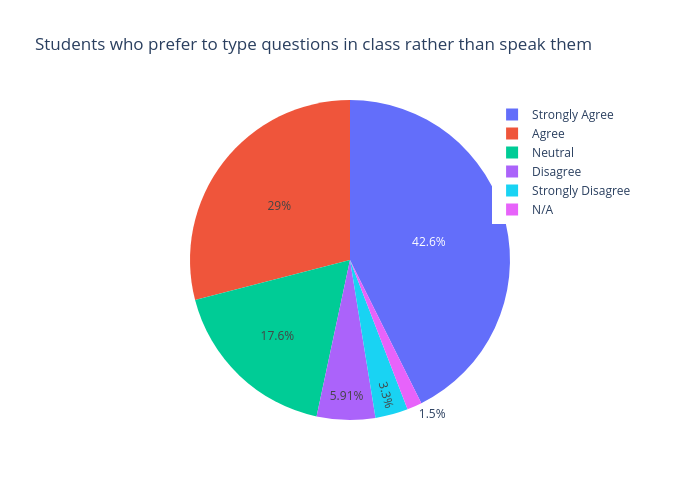
Hbrunelle24's interactive graph and data of "Students who prefer to type questions in class rather than speak them" is a pie. The x-axis shows values from -1 to 6. The y-axis shows values from -1 to 4.