Edit chart
Loading graph
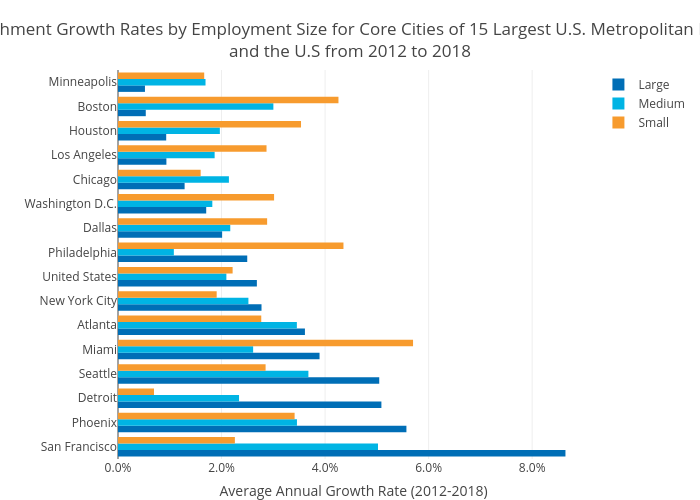
Hbajwa1's interactive graph and data of "Establishment Growth Rates by Employment Size for Core Cities of 15 Largest U.S. Metropolitan Regionsand the U.S from 2012 to 2018" is a bar chart, showing Large, Medium, Small; with Average Annual Growth Rate (2012-2018) in the x-axis. The x-axis shows values from 0 to 0. The y-axis shows values from 0 to 0.