Edit chart
Loading graph
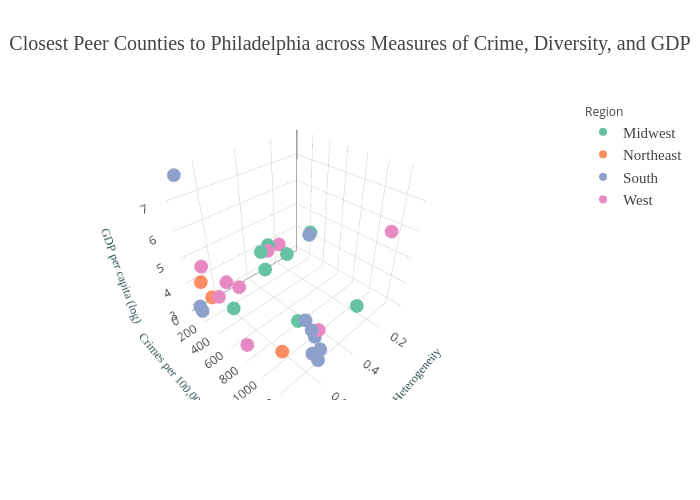
Hbajwa1's interactive graph and data of "Closest Peer Counties to Philadelphia across Measures of Crime, Diversity, and GDP" is a scatter3d, showing Midwest, Northeast, South, West. The x-axis shows values from 0 to 0. The y-axis shows values from 0 to 0.