Edit chart
Loading graph
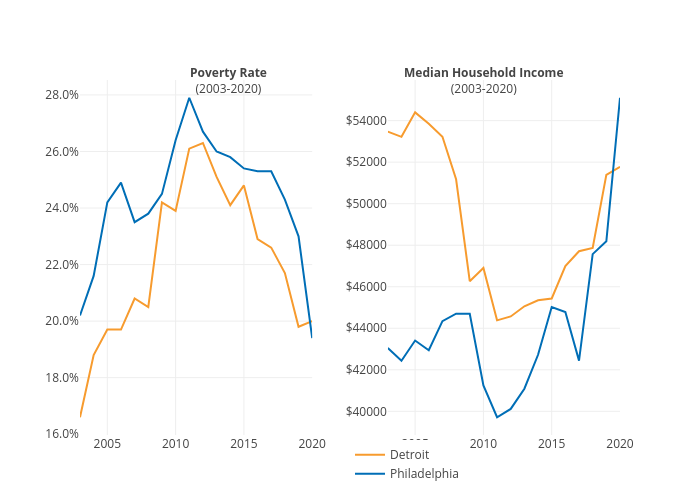
Hbajwa1's interactive graph and data of "Detroit, Philadelphia, Detroit, Philadelphia" is a line chart, showing Detroit, Philadelphia, Detroit, Philadelphia. The x-axis shows values from 0 to 0. The y-axis shows values from 0 to 0. This visualization has the following annotations: Poverty Rate(2003-2020); Median Household Income(2003-2020)