Edit chart
Loading graph
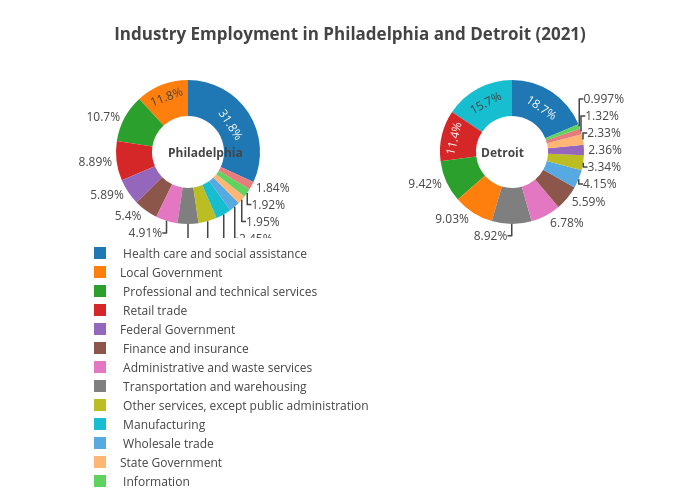
Hbajwa1's interactive graph and data of "Industry Employment in Philadelphia and Detroit (2021)" is a pie. The x-axis shows values from 0 to 0. The y-axis shows values from 0 to 0. This visualization has the following annotations: Philadelphia; Detroit