Edit chart
Loading graph
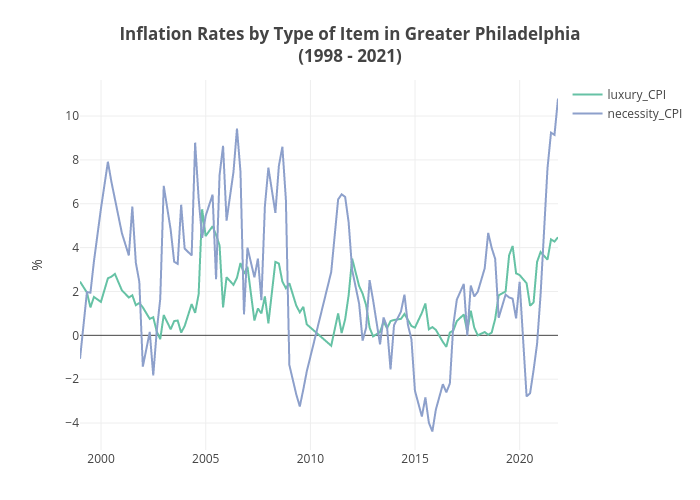
Hbajwa1's interactive graph and data of "Inflation Rates by Type of Item in Greater Philadelphia(1998 - 2021)" is a line chart, showing luxury_CPI vs necessity_CPI; with % in the y-axis. The x-axis shows values from 0 to 0. The y-axis shows values from 0 to 0.