Edit chart
Loading graph
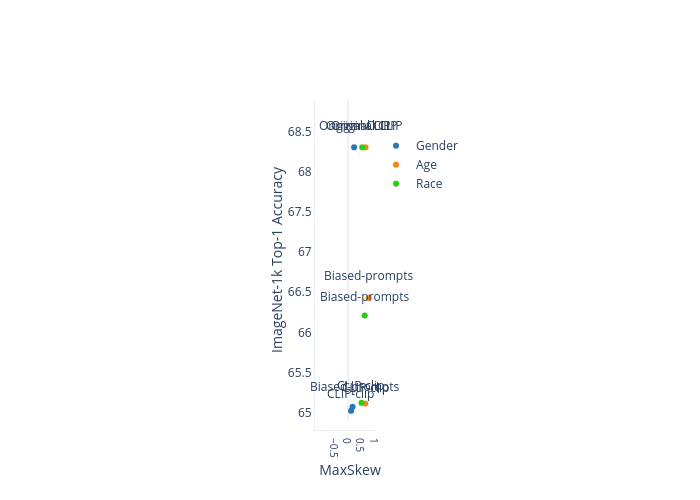
Haoyusimon927's interactive graph and data of "" is a scatter chart, showing Gender, Age, Race; with MaxSkew in the x-axis and ImageNet-1k Top-1 Accuracy in the y-axis.. The x-axis shows values from -0.07037089884313708 to 1.0564891170110535. The y-axis shows values from 64.90513815487353 to 68.9010361473014. This visualization has the following annotations: Original CLIP; CLIP-clip; Biased-prompts; Original CLIP; Original CLIP; CLIP-clip; Biased-prompts; CLIP-clip; Biased-prompts